Tableau is a powerful visualization tool, but as dashboards grow more complex and user bases expand, performance issues creep in a lot of times. Solution to all those bottlenecks is LogShark, an open-source utility from Tableau designed to transform log files into readable, visual workbooks. Whether you’re a Tableau Server admin or an advanced power user, LogShark can help you identify root causes of performance lags, failed workbooks, or inefficient data sources.
LogShark is a command-line tool that processes Tableau Server log files and creates a set of Tableau workbooks to help you visualize performance issues, errors, and trends. It’s especially helpful after enabling Performance Recording or during root cause analysis following an incident.
When Should We Use LogShark?
- If any dashboard crashes or fails to load frequently
- When experiencing slow server performance
- To audit long-running queries (or to audit user behavior 😊)
- Or Post-upgrade validation or troubleshooting
Preparation for installing Logshark
1) System Requirements
- 64-bit version of Windows Server (2008 R2 or later)
- An account with local administrator privileges on the machine where you want to install Logshark
- .NET Framework 4.5.1 (or later versions)
- Automatically installed when you install Logshark
- Use a computer with the latest hardware and software available
- Logshark’s ability to process log files increases with increased CPU, memory, and disk I/O performance.
- Tableau Desktop v10.5 (or later)
2) LogShark Plugins
To run a specific plugin, specify the name of the plugin with the LogShark –plugins option. To specify more than one plugin, list them separated by a semicolon, no spaces, and enclose the list in quotation marks (“ “).
Usage:
LogShark LogSetLocation RunId
LogShark LogSetLocation RunId –plugins plugin
LogShark LogSetLocation RunId –plugins “plugin1 plugin2 plugin3…”
Examples:
LogShark logs.zip –plugins Apache LogShark logs.zip –plugins “Apache;VizqlServer”
(Refer table underneath to understand plugin required for any visual)
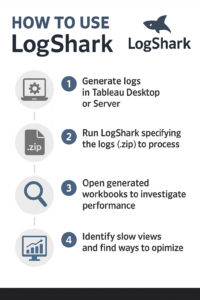
3) Step-by-Step Guide to Using LogShark
- Download and Install LogShark
- Download the latest release from Tableau’s GitHub repository: LogShark GitHub
- Extract and place it in an accessible directory
(Note that LogShark is configured by the LogSharkConfig.json file in the Config directory. If you are replacing an existing copy of LogShark, be mindful of any changes made to this configuration file.)
- Collect Log Files
- Use tsm maintenance ziplogs -a or tabadmin ziplogs to collect the logs from Tableau Server
- This generates a .zip file containing logs related to VizQL, Apache, Backgrounder, etc.
- Run LogShark
From the command prompt, run (as admin):
Logshark C:\Users\xxxxxx\Desktop\logs.zip
This will process the logs and generate Tableau workbook output files in a new folder.
- Explore the Workbooks
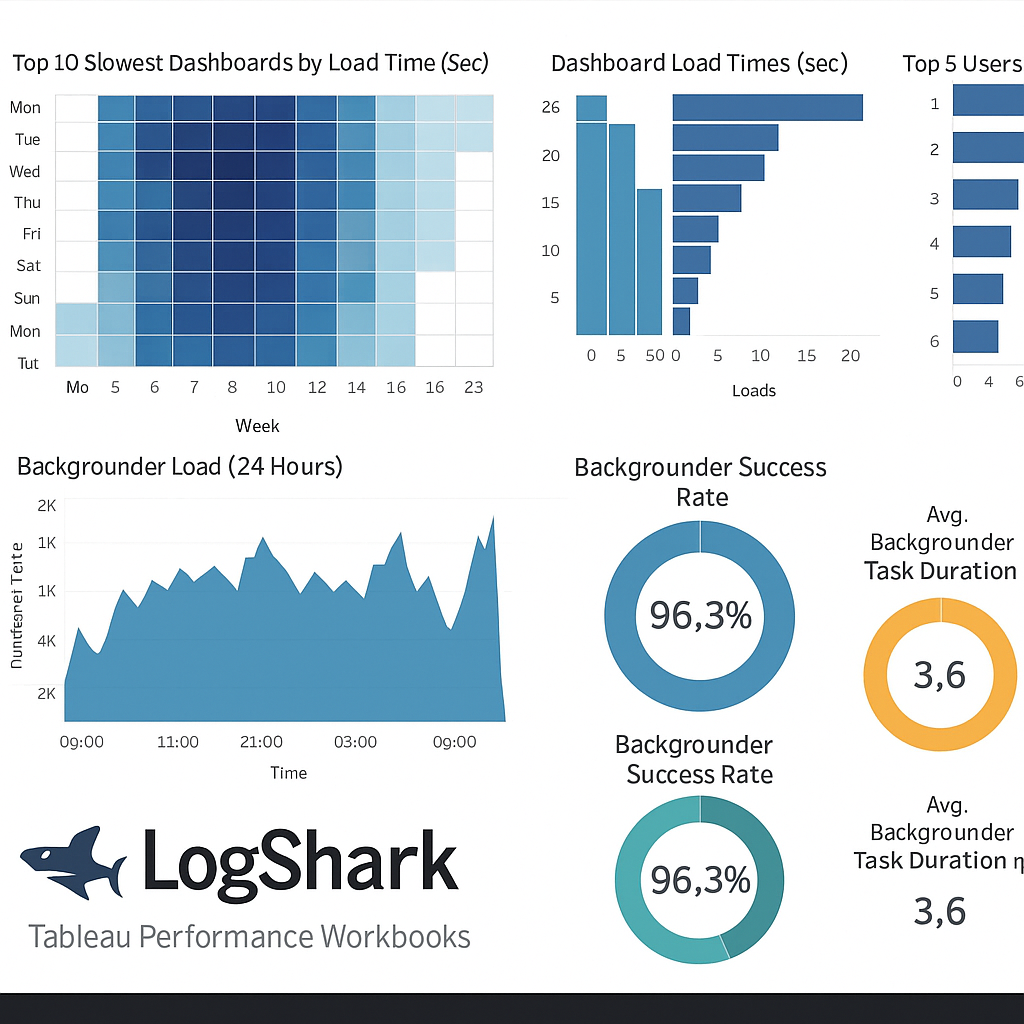
Open the .twbx files created by LogShark in Tableau Desktop. These usually include:
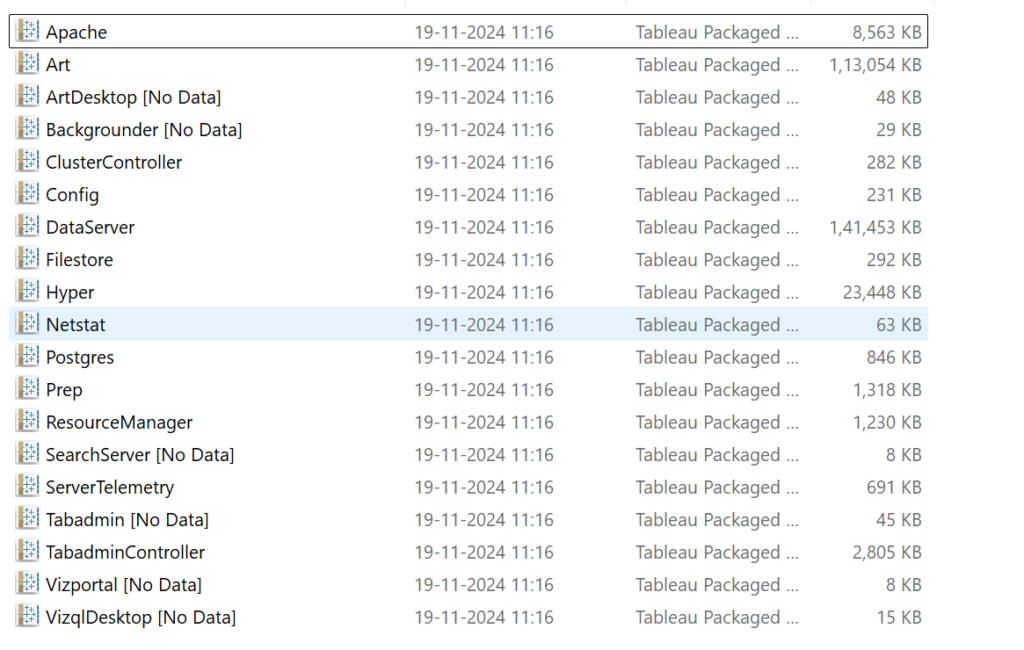
| Process | Workbook | Description |
| Art | Art.twbx | Analyze VizQLServer Activity Resource Tracing information for performance details of view loads. Similar to ServerTelemetry plugin. |
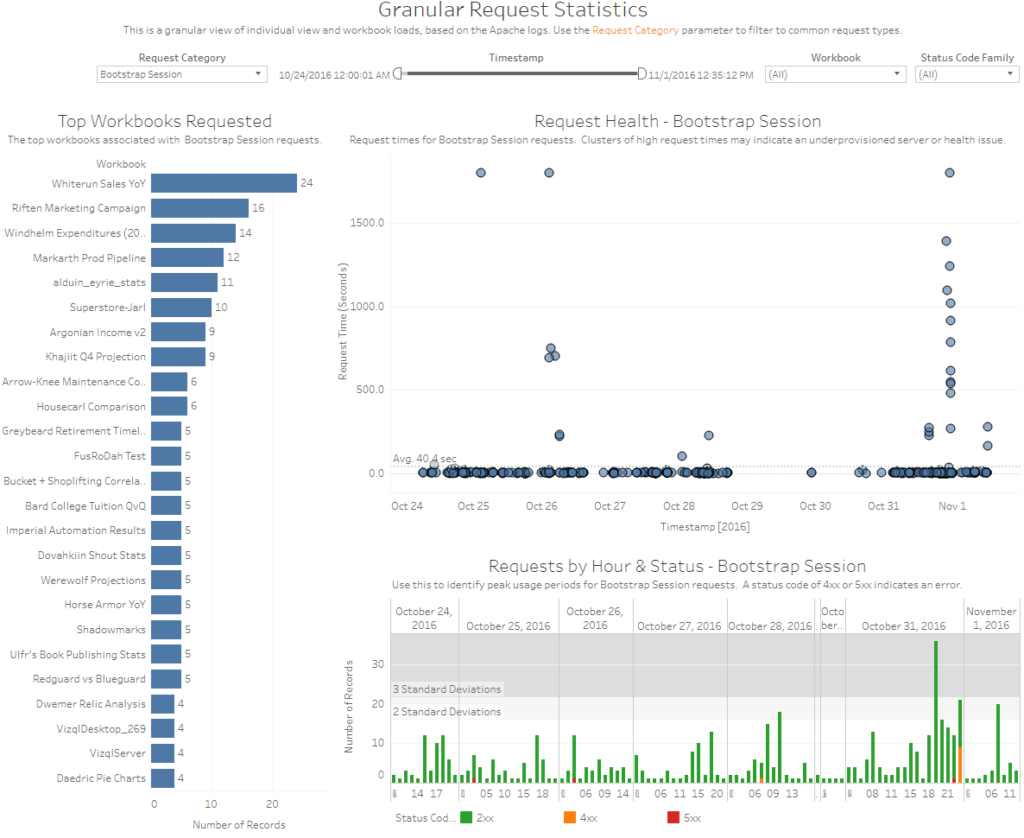
| Apache | Apache.twbx | Collect and analyze workbook statistics on Tableau Server from the Apache (http) log files, including viz load times, view counts, errors, and warnings. |
| Backgrounder | Backgrounder.twbx | Displays information about Tableau Server background tasks and jobs, such as subscriptions and extract refreshes. Data is taken from the backgrounder log files. |
| ClusterController | ClusterController.twbx | Displays information about Tableau Server Cluster Controller events and errors, taken from the clustercontroller and zookeeper log files. Also includes some information about disk performance. |
| Config | Config.twbx | Displays the Tableau Server topology and configuration settings from the log files. |
| Filestore | Filestore.twbx | Displays information about Tableau Server File Store events and errors. |
| Hyper | Hyper.twbx | Displays information about Hyper activity, including extract generation and extract query details. |
| Netstat | Netstat.twbx | Displays information about transport-layer port reservations taken from the Netstat output files in a Server logset. The ziplogs must have been taken with the –n argument in order to contain Netstat data. |
| Postgres | Postgres.twbx | Displays information about Tableau Server Repository events and errors, including application query details. |
| ResourceManager | ResourceManager.twbx | Shows information harvested from the Server Resource Manager log events. Workbook includes metrics on CPU utilization, memory utilization, and process recycling events. |
| SearchServer | SearchServer.twbx | Displays information about Tableau Server Search & Browser service, including search indexing events. |
| Tabadmin | Tabadmin.twbx | Displays Tableau Server admin (tabadmin) activities from the log files, including Tableau Server starts, stops, backup, and error history. |
Common Advantages with LogShark
- Using LogShark transforms troubleshooting from a guessing game into a data-driven process.
- It helps Tableau professionals turn messy logs into actionable insights.
- Whether you’re fine-tuning dashboards or investigating a major slowdown, LogShark arms you with the visibility needed to ensure a smooth user experience.
Common Performance Bottlenecks Identified by LogShark
- Long-running queries (e.g., complex calculations, nested LODs)
- Delays in rendering due to image-heavy or high-cardinality views
- Inefficient extract refreshes
- Too many simultaneous background jobs
Sample Workbook